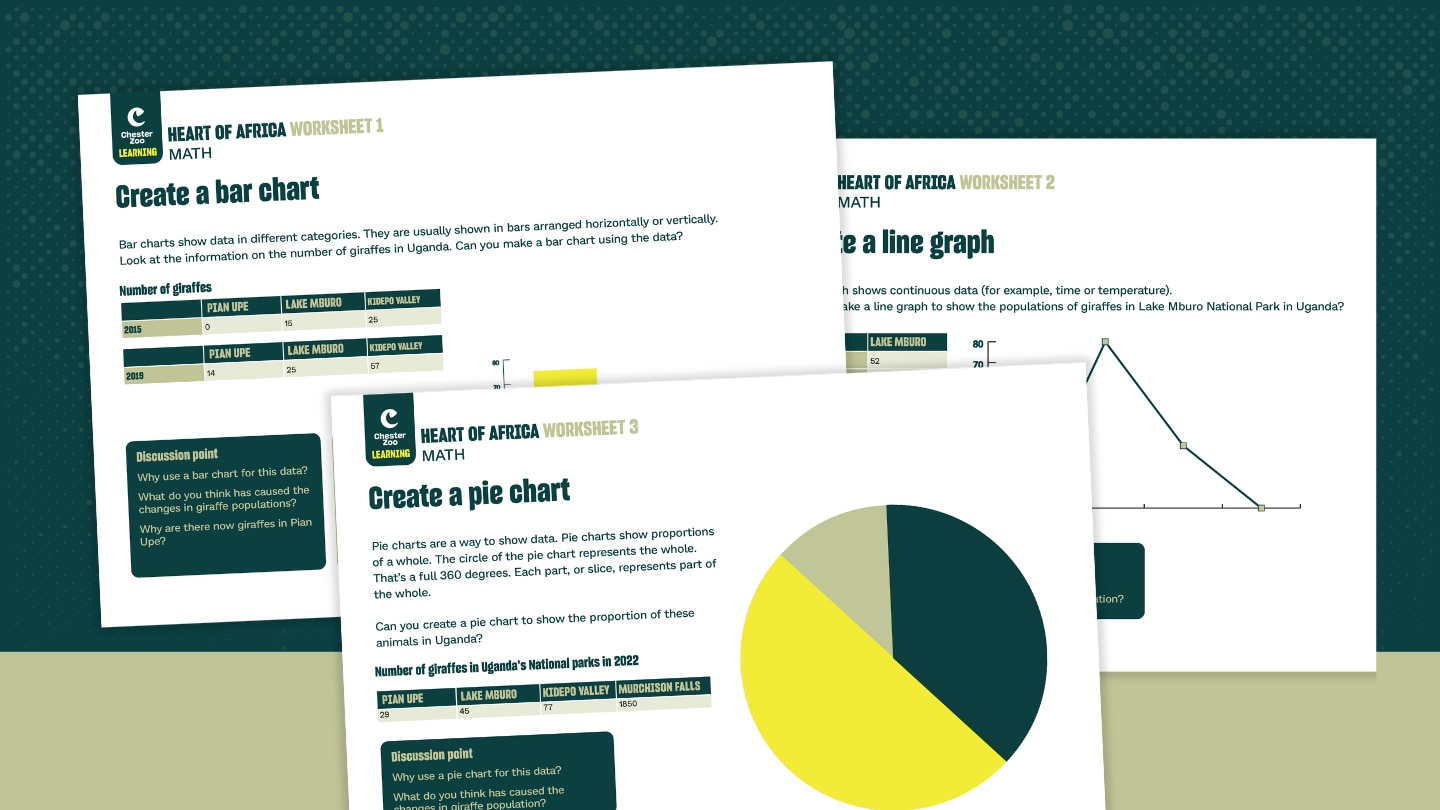
Monitoring animal populations is important to assess if the animal is endangered or threatened, to meausre biological diversity, and to examine the effects of human actions. And it's something our friends at the Chester Zoo do a lot! Try your hand at it with giraffe data and learn some important math skills on the way. Compare giraffe populations in different Ugandan national parks using:
- Bar charts
- Line graphs
- Pie charts
These worksheets accompany a Chester Zoo interactive lesson on graphs.
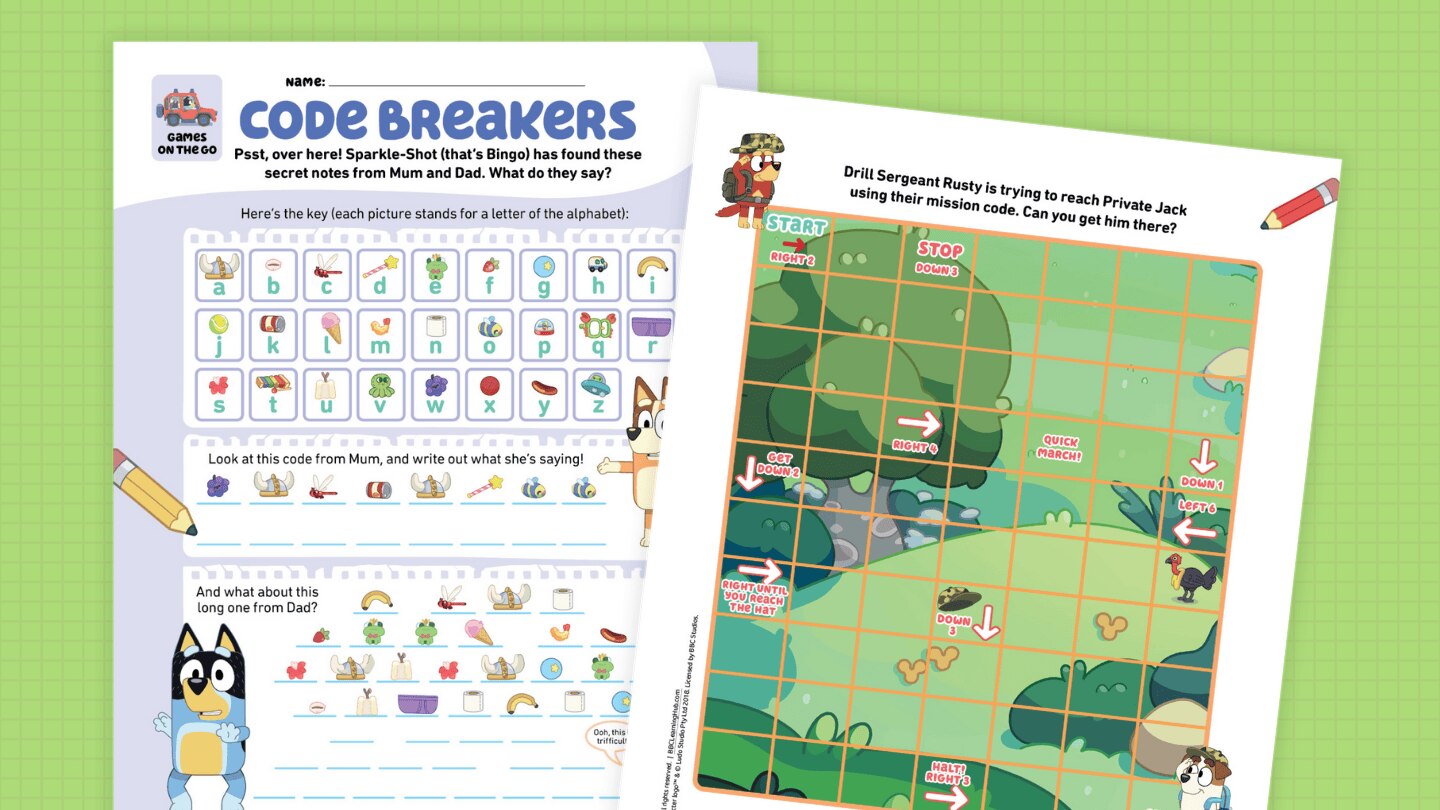
Psst, over here! Sparkle-Shot (that’s Bingo) has found these secret notes from Mum and Dad. What do they say? Look at the code from Mum and write out what she's saying! And what about a long message from Dad? Plus, help Drill Sergeant Rusty reach Private Jack using their mission code.
For extra fun, why not make up your own mission code and test it out with a friend? It could be in your bedroom or school playground or park. You could even swap secret messages using Mum and Dad’s alphabet code!
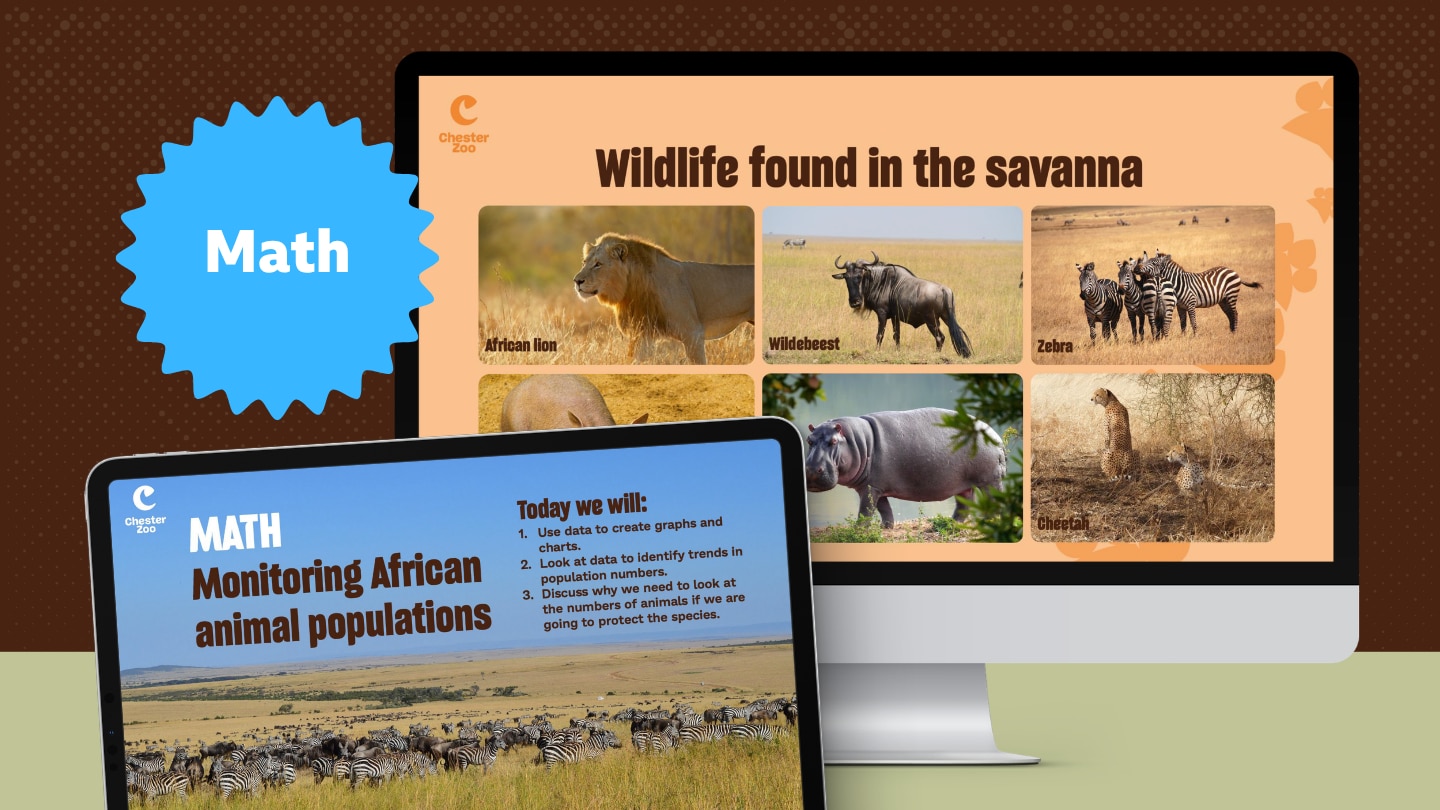
Math meets wildlife conservation! How do you know if a population of animals is growing or shrinking? And how can numbers help protect species in the wild? Join Chester Zoo to explore the African savanna and discover how conservationists use data to understand what is happening to wildlife populations.
Meet some of the animals that call the savanna home, then find out how Chester Zoo and its conservation partners monitor animals such as northern giraffes. You'll see how cameras, trackers, and other methods can help scientists gather information about animals in the wild — and why collecting accurate data matters.
Then become a conservation data detective! Work with real wildlife population data to spot trends and turn numbers into bar charts, line graphs, and pie charts. You'll investigate what different kinds of graphs can tell us and consider why scientists and conservation organizations need to communicate their findings clearly.
Finally, take what you've learned beyond the numbers. Use data to think about how people can make choices that help wildlife, collect information from your own class, and turn your findings into a message that could inspire others to take action.
Don't miss the graph worksheets that go with this lesson!

In The Magic of Math on the Soccer Field, host Marcus du Sautoy tries to convince one math reject that math is present everywhere in the soccer game he loves — from quadratic equations on the pitch to the probability of a team winning. Du Sautoy makes the case that the soccer players are intuitive mathematical geniuses. This video is excerpted from BBC’s Horizon: Why Maths Doesn’t Add Up, where Marcus du Sautoy introduces the elegance and wonder of math to a “math reject,” traveling from the classroom to a four-dimensional world.
Monitoring animal populations is important to assess if the animal is endangered or threatened, to meausre biological diversity, and to examine the effects of human actions. And it's something our friends at the Chester Zoo do a lot! Try your hand at it with giraffe data and learn some important math skills on the way. Compare giraffe populations in different Ugandan national parks using:
- Bar charts
- Line graphs
- Pie charts
These worksheets accompany a Chester Zoo interactive lesson on graphs.
Psst, over here! Sparkle-Shot (that’s Bingo) has found these secret notes from Mum and Dad. What do they say? Look at the code from Mum and write out what she's saying! And what about a long message from Dad? Plus, help Drill Sergeant Rusty reach Private Jack using their mission code.
For extra fun, why not make up your own mission code and test it out with a friend? It could be in your bedroom or school playground or park. You could even swap secret messages using Mum and Dad’s alphabet code!
Math meets wildlife conservation! How do you know if a population of animals is growing or shrinking? And how can numbers help protect species in the wild? Join Chester Zoo to explore the African savanna and discover how conservationists use data to understand what is happening to wildlife populations.
Meet some of the animals that call the savanna home, then find out how Chester Zoo and its conservation partners monitor animals such as northern giraffes. You'll see how cameras, trackers, and other methods can help scientists gather information about animals in the wild — and why collecting accurate data matters.
Then become a conservation data detective! Work with real wildlife population data to spot trends and turn numbers into bar charts, line graphs, and pie charts. You'll investigate what different kinds of graphs can tell us and consider why scientists and conservation organizations need to communicate their findings clearly.
Finally, take what you've learned beyond the numbers. Use data to think about how people can make choices that help wildlife, collect information from your own class, and turn your findings into a message that could inspire others to take action.
Don't miss the graph worksheets that go with this lesson!
In The Magic of Math on the Soccer Field, host Marcus du Sautoy tries to convince one math reject that math is present everywhere in the soccer game he loves — from quadratic equations on the pitch to the probability of a team winning. Du Sautoy makes the case that the soccer players are intuitive mathematical geniuses. This video is excerpted from BBC’s Horizon: Why Maths Doesn’t Add Up, where Marcus du Sautoy introduces the elegance and wonder of math to a “math reject,” traveling from the classroom to a four-dimensional world.