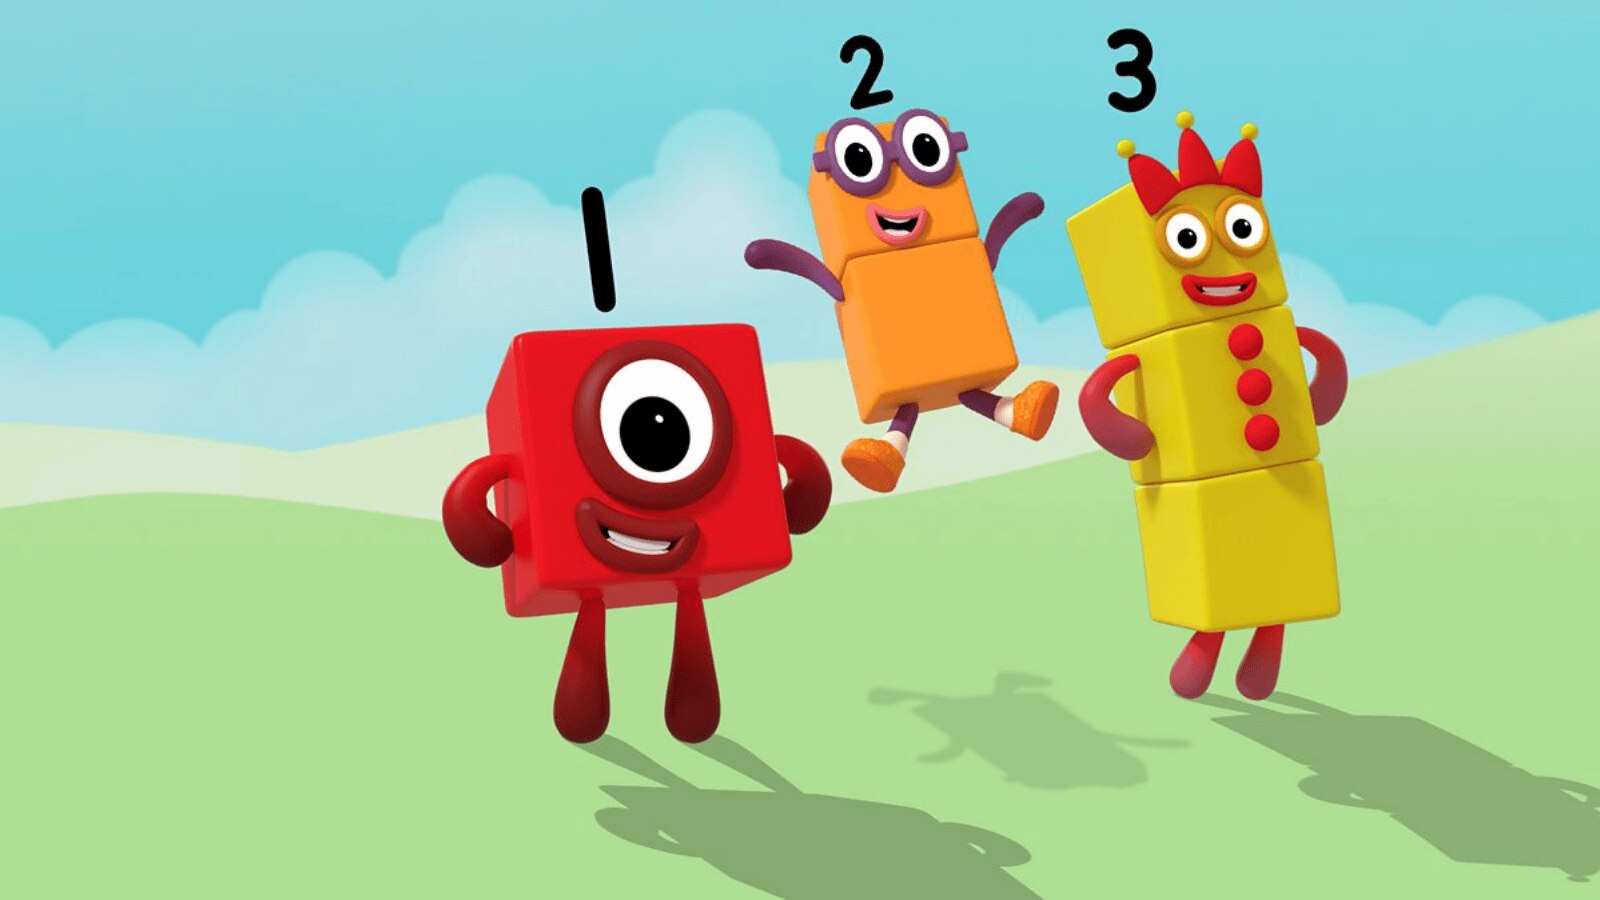
Meet the Numberblocks — little blocks with big ideas who make learning numbers fun and exciting for young children ages 3–7. Numberblocks helps kids build number sense as the characters come together, break apart, and explore how numbers really work. This free collection of printable games and colorful worksheets games give little learners hands-on practice with counting, odd and even numbers, and simple addition and subtraction. Perfect for use at home or in the classroom, these ready-to-use activities turn math practice into joyful play.
Plus, watch full episodes on the official Numberblocks YouTube channel!
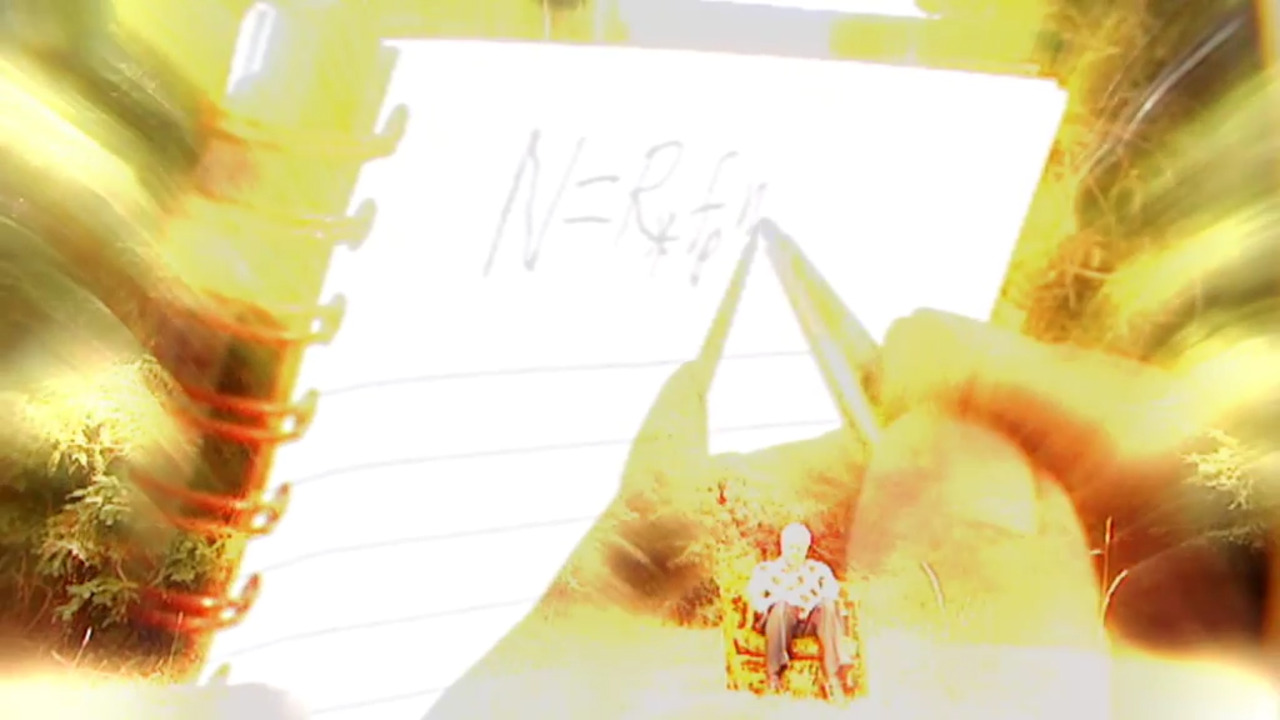
In Searching for Life in Our Universe Using Math, scientists explore how math can be used to estimate the number of intelligent civilizations in our galaxy. Learn about Frank Drake's famous equation, which considers factors such as the rate of star formation, the number of stars with planets, and the potential for life on those planets. Despite the vastness of the Universe, the equation relies on factors that are still largely unknown, making the search for intelligent life a complex and ongoing challenge.
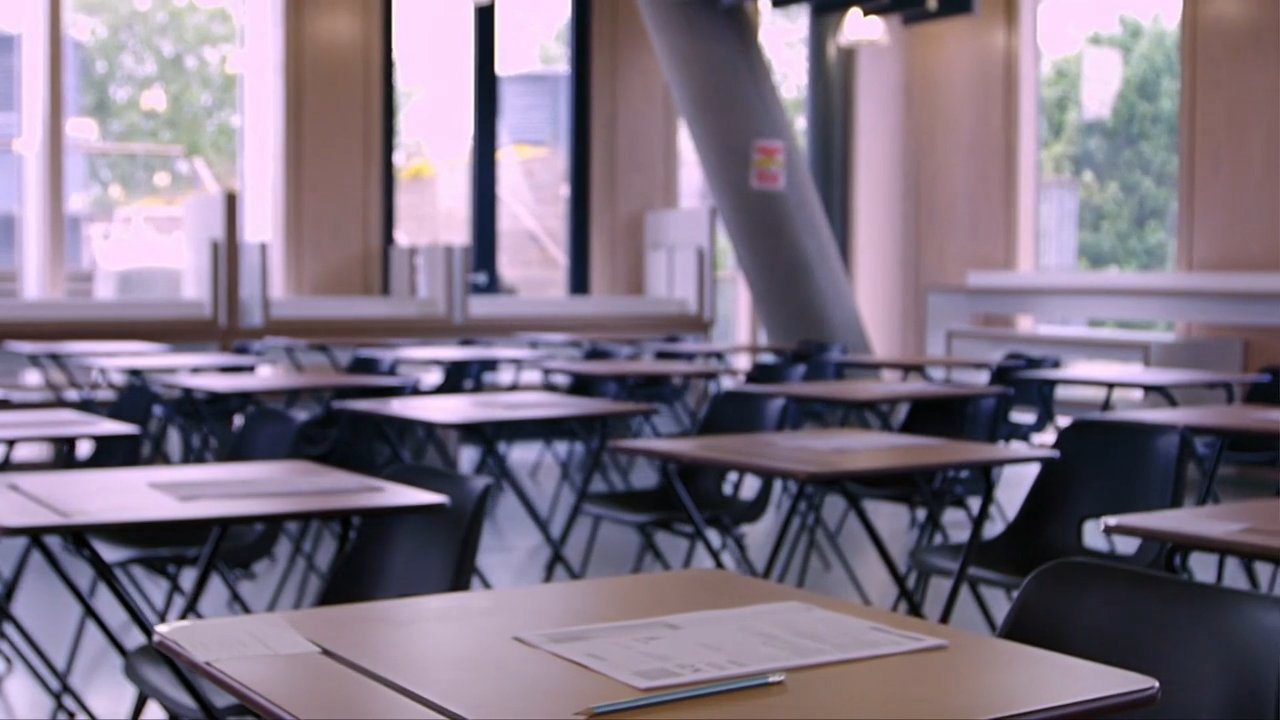
Every student, everywhere, knows the feeling: walking out of a big exam with no idea if you did well or completely bombed it. This year, that feeling hit an entire country at once.
In the UK, this year's math exams were unusually tough — tough enough that students flooded social media with one shared message: "that test kicked my butt." And it wasn't about skipping study time or being dramatic. Many said the exam's structure meant you could know the material and still not be able to show it.
Here's why: the questions were worded differently than in past years. If a student got stuck on the first part of a question, they couldn't move on to the rest — like having the perfect ice cream sundae recipe, but the ice cream and toppings are locked in a vault guarded by a saber-toothed parabola.
Not everyone agreed the test was actually harder. Some math experts said the calculations themselves were standard, and students should have been able to solve them. So who's right?
It's not really a students vs. experts argument. When exam boards set the grades for a test like this, they review a wide range of evidence to make sure students end up with fair results — not just the raw difficulty of the questions. The organization that oversees UK exams also said it will keep a close eye on this one going forward.
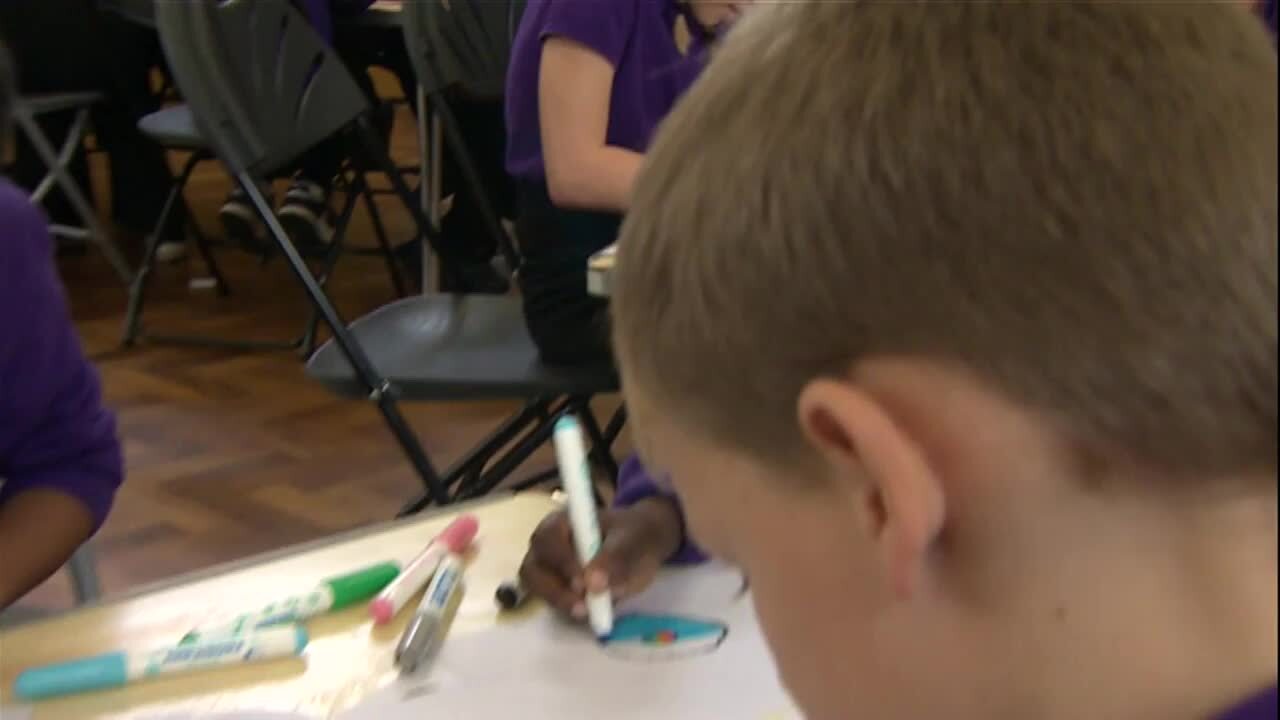
You’ve probably never thought about combining math and art class, but maybe now, you will! This teacher shares his new approach to math, where he uses colors to represent different numbers.
He assigned 10 numbers to 10 different colors — zero is white, one is black, two is red, and so on. That means combinations of numbers become combinations of colors. The result is an equation that’s educational and pretty at the same time!
What starts as multiplication or patterns quickly begins to look more like art class than math class. But behind the colors is real number sense, memory tricks, and a whole new way of thinking about equations. Turns out math might be a lot more visual — and creative — than most people realize.
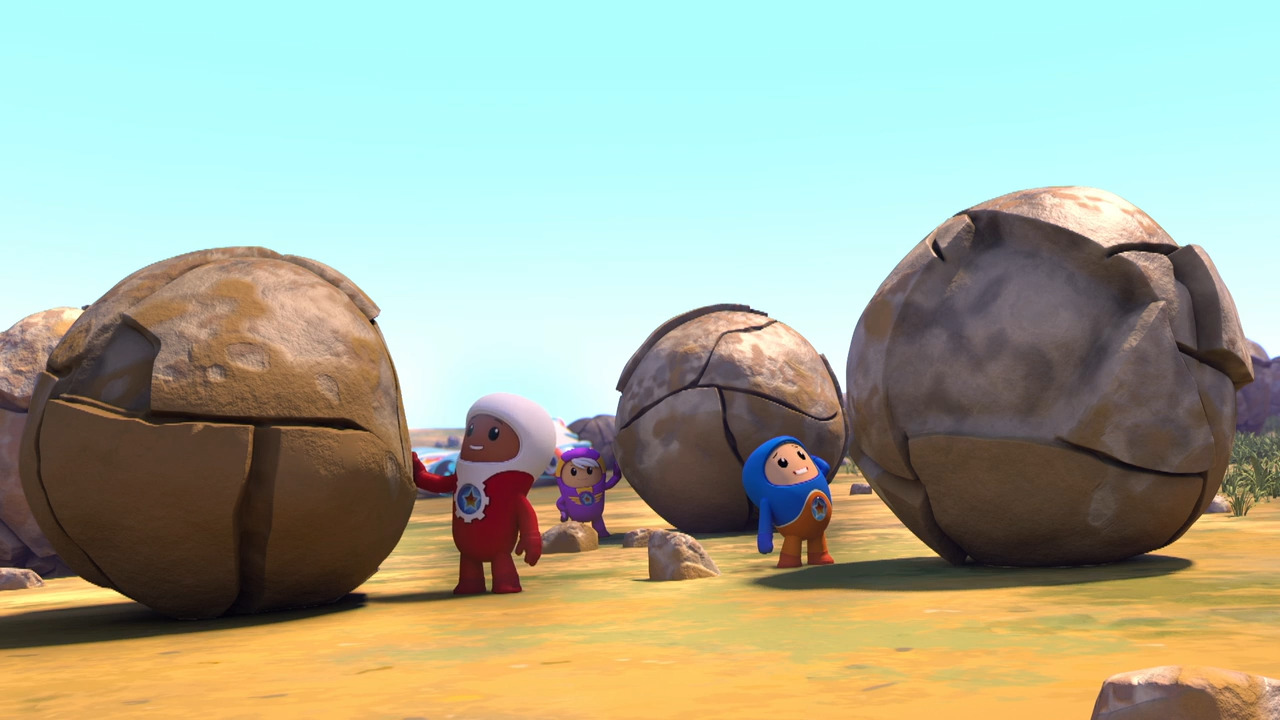
In The Go Jetters and the Mysterious Valley of Balls, the Go Jetter crew is in Kazakhstan visiting the Valley of Balls. The valley is known for its thousands of almost perfectly round rocks. Ubercorn shares funky facts about how the rocks were formed and the mystery that still surrounds these spherical wonders. This video is excerpted from BBC’s Go Jetters, a series that follows the adventures of four international heroes as they travel the globe visiting landmarks and solving environmental problems with Ubercorn, a disco-dancing unicorn.

In The Magic of Math on the Soccer Field, host Marcus du Sautoy tries to convince one math reject that math is present everywhere in the soccer game he loves — from quadratic equations on the pitch to the probability of a team winning. Du Sautoy makes the case that the soccer players are intuitive mathematical geniuses. This video is excerpted from BBC’s Horizon: Why Maths Doesn’t Add Up, where Marcus du Sautoy introduces the elegance and wonder of math to a “math reject,” traveling from the classroom to a four-dimensional world.
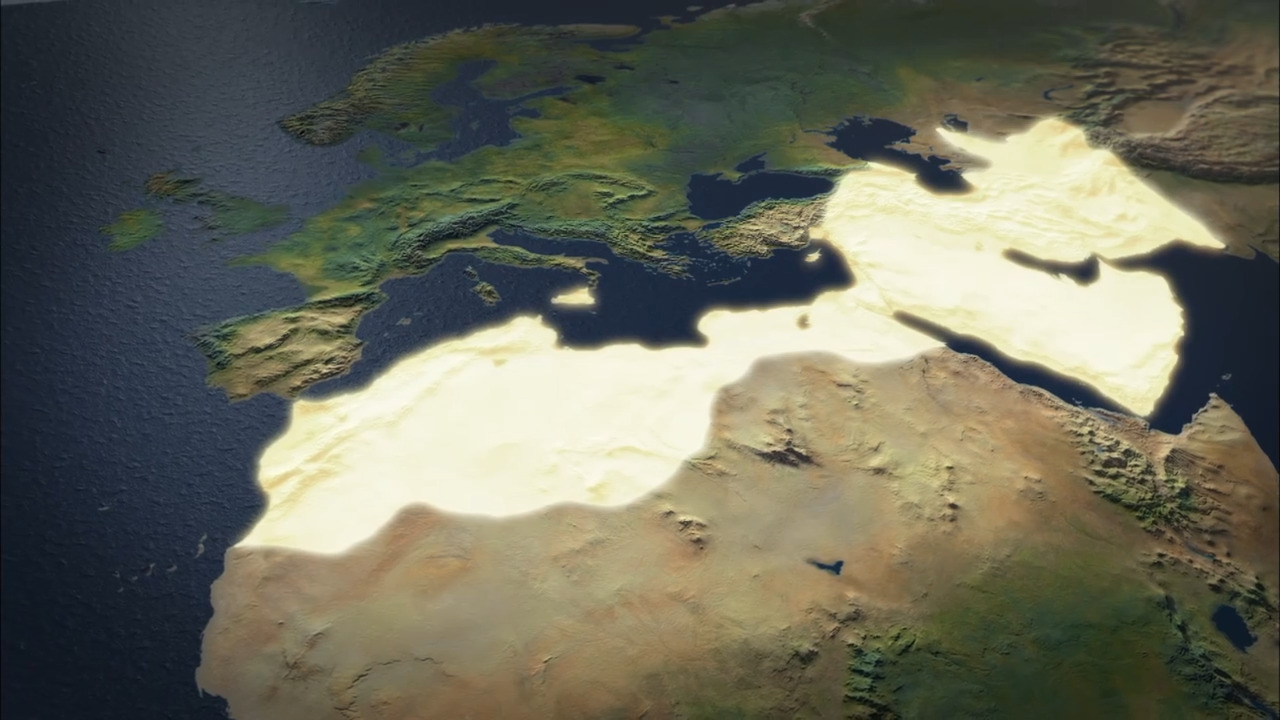
In Islamic Advances in Math and Science Helped Update the Math of the World, host Andrew Marr takes us back to the 9th Century. The Islamic scholar Muhammad al-Khwarizmi and other scholars are using measurements and calculations to calculate the Earth’s circumference and create an updated map the Earth. Learn how the work of the Islamic scholars impacts today’s technology and mathematics. This video is excerpted from BBC’s Andrew Marr's History of the World, a story of human history that uses reenactments, modern footage, and storytelling to explain history’s greatest achievements.
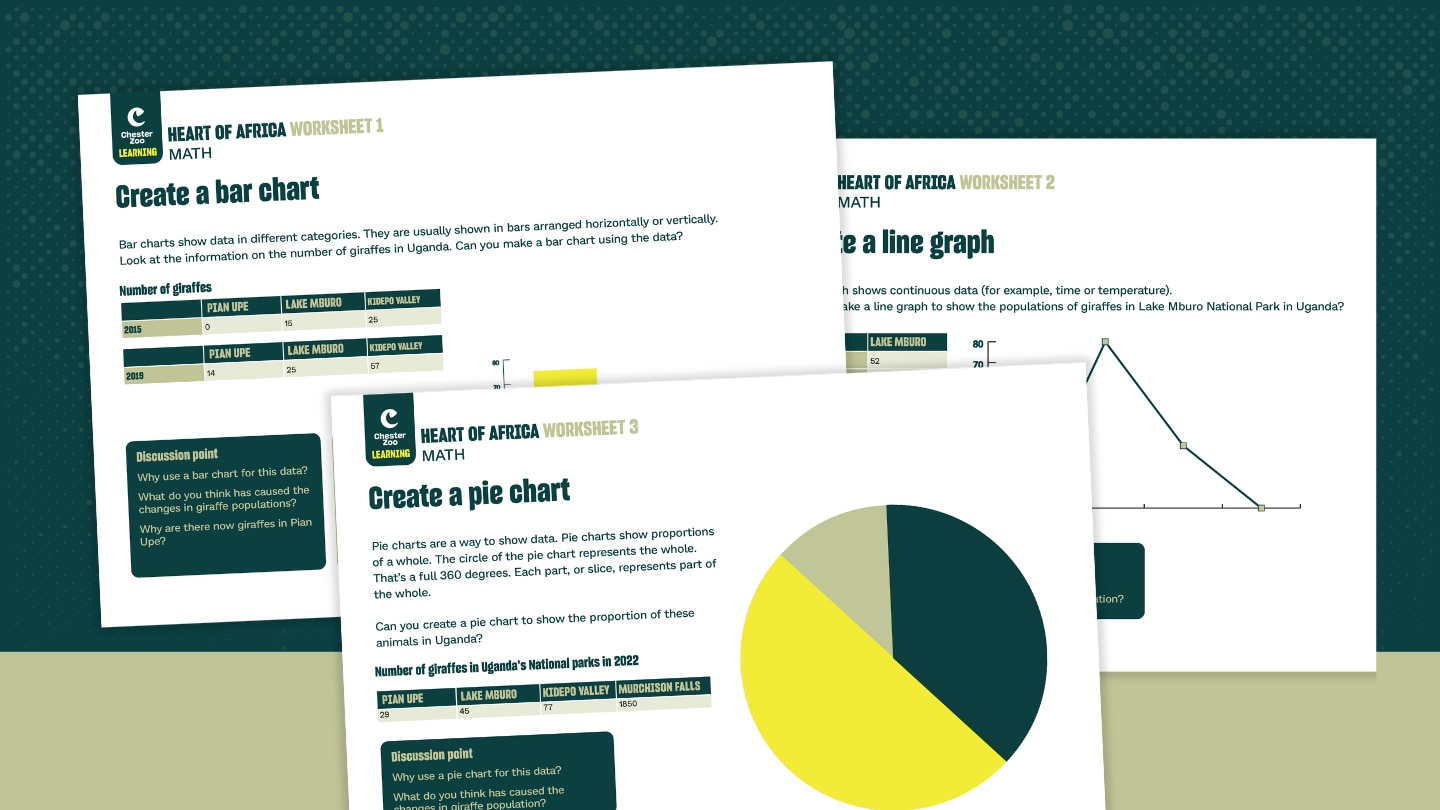
Monitoring animal populations is important to assess if the animal is endangered or threatened, to meausre biological diversity, and to examine the effects of human actions. And it's something our friends at the Chester Zoo do a lot! Try your hand at it with giraffe data and learn some important math skills on the way. Compare giraffe populations in different Ugandan national parks using:
- Bar charts
- Line graphs
- Pie charts
These worksheets accompany a Chester Zoo interactive lesson on graphs.
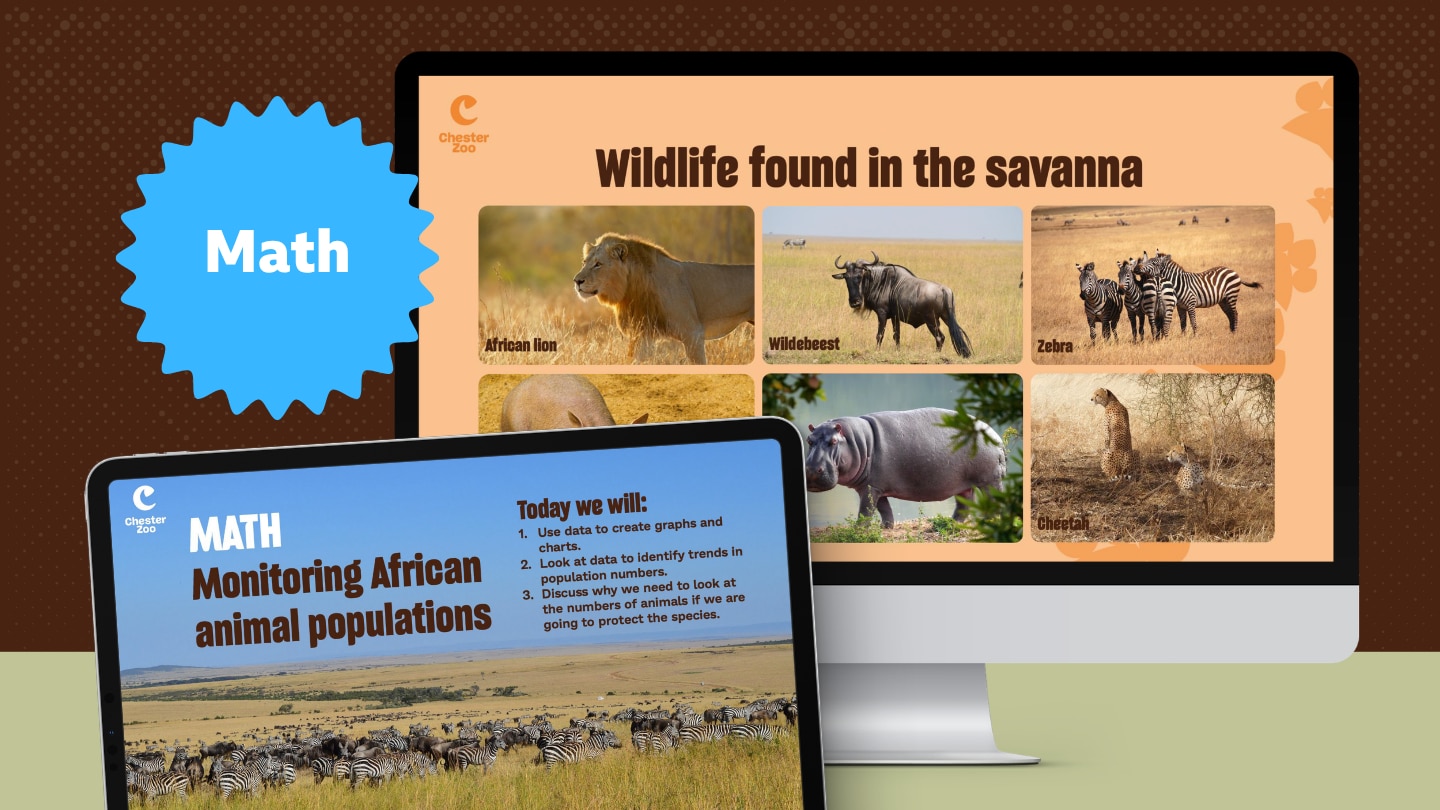
Math meets wildlife conservation! How do you know if a population of animals is growing or shrinking? And how can numbers help protect species in the wild? Join Chester Zoo to explore the African savanna and discover how conservationists use data to understand what is happening to wildlife populations.
Meet some of the animals that call the savanna home, then find out how Chester Zoo and its conservation partners monitor animals such as northern giraffes. You'll see how cameras, trackers, and other methods can help scientists gather information about animals in the wild — and why collecting accurate data matters.
Then become a conservation data detective! Work with real wildlife population data to spot trends and turn numbers into bar charts, line graphs, and pie charts. You'll investigate what different kinds of graphs can tell us and consider why scientists and conservation organizations need to communicate their findings clearly.
Finally, take what you've learned beyond the numbers. Use data to think about how people can make choices that help wildlife, collect information from your own class, and turn your findings into a message that could inspire others to take action.
Don't miss the graph worksheets that go with this lesson!

In How Data Transformed Trading, discover how data became a powerful tool for understanding human behavior — and making big money! Meet David Harding, a science graduate who shook up the chaotic world of trading by using math and data to predict price patterns. While others trusted their gut, Harding believed data and the right computer algorithms could crack the code of the stock market. Today, his company invests billions, proving that smart data (and a little science) can change the game! This video is excerpted from BBC’s Horizon: The Age of Big Data, which explores how data has shaped industries, economies, and human behavior.
Meet the Numberblocks — little blocks with big ideas who make learning numbers fun and exciting for young children ages 3–7. Numberblocks helps kids build number sense as the characters come together, break apart, and explore how numbers really work. This free collection of printable games and colorful worksheets games give little learners hands-on practice with counting, odd and even numbers, and simple addition and subtraction. Perfect for use at home or in the classroom, these ready-to-use activities turn math practice into joyful play.
Plus, watch full episodes on the official Numberblocks YouTube channel!
In Searching for Life in Our Universe Using Math, scientists explore how math can be used to estimate the number of intelligent civilizations in our galaxy. Learn about Frank Drake's famous equation, which considers factors such as the rate of star formation, the number of stars with planets, and the potential for life on those planets. Despite the vastness of the Universe, the equation relies on factors that are still largely unknown, making the search for intelligent life a complex and ongoing challenge.
Every student, everywhere, knows the feeling: walking out of a big exam with no idea if you did well or completely bombed it. This year, that feeling hit an entire country at once.
In the UK, this year's math exams were unusually tough — tough enough that students flooded social media with one shared message: "that test kicked my butt." And it wasn't about skipping study time or being dramatic. Many said the exam's structure meant you could know the material and still not be able to show it.
Here's why: the questions were worded differently than in past years. If a student got stuck on the first part of a question, they couldn't move on to the rest — like having the perfect ice cream sundae recipe, but the ice cream and toppings are locked in a vault guarded by a saber-toothed parabola.
Not everyone agreed the test was actually harder. Some math experts said the calculations themselves were standard, and students should have been able to solve them. So who's right?
It's not really a students vs. experts argument. When exam boards set the grades for a test like this, they review a wide range of evidence to make sure students end up with fair results — not just the raw difficulty of the questions. The organization that oversees UK exams also said it will keep a close eye on this one going forward.
You’ve probably never thought about combining math and art class, but maybe now, you will! This teacher shares his new approach to math, where he uses colors to represent different numbers.
He assigned 10 numbers to 10 different colors — zero is white, one is black, two is red, and so on. That means combinations of numbers become combinations of colors. The result is an equation that’s educational and pretty at the same time!
What starts as multiplication or patterns quickly begins to look more like art class than math class. But behind the colors is real number sense, memory tricks, and a whole new way of thinking about equations. Turns out math might be a lot more visual — and creative — than most people realize.
In The Go Jetters and the Mysterious Valley of Balls, the Go Jetter crew is in Kazakhstan visiting the Valley of Balls. The valley is known for its thousands of almost perfectly round rocks. Ubercorn shares funky facts about how the rocks were formed and the mystery that still surrounds these spherical wonders. This video is excerpted from BBC’s Go Jetters, a series that follows the adventures of four international heroes as they travel the globe visiting landmarks and solving environmental problems with Ubercorn, a disco-dancing unicorn.
In The Magic of Math on the Soccer Field, host Marcus du Sautoy tries to convince one math reject that math is present everywhere in the soccer game he loves — from quadratic equations on the pitch to the probability of a team winning. Du Sautoy makes the case that the soccer players are intuitive mathematical geniuses. This video is excerpted from BBC’s Horizon: Why Maths Doesn’t Add Up, where Marcus du Sautoy introduces the elegance and wonder of math to a “math reject,” traveling from the classroom to a four-dimensional world.
In Islamic Advances in Math and Science Helped Update the Math of the World, host Andrew Marr takes us back to the 9th Century. The Islamic scholar Muhammad al-Khwarizmi and other scholars are using measurements and calculations to calculate the Earth’s circumference and create an updated map the Earth. Learn how the work of the Islamic scholars impacts today’s technology and mathematics. This video is excerpted from BBC’s Andrew Marr's History of the World, a story of human history that uses reenactments, modern footage, and storytelling to explain history’s greatest achievements.
Monitoring animal populations is important to assess if the animal is endangered or threatened, to meausre biological diversity, and to examine the effects of human actions. And it's something our friends at the Chester Zoo do a lot! Try your hand at it with giraffe data and learn some important math skills on the way. Compare giraffe populations in different Ugandan national parks using:
- Bar charts
- Line graphs
- Pie charts
These worksheets accompany a Chester Zoo interactive lesson on graphs.
Math meets wildlife conservation! How do you know if a population of animals is growing or shrinking? And how can numbers help protect species in the wild? Join Chester Zoo to explore the African savanna and discover how conservationists use data to understand what is happening to wildlife populations.
Meet some of the animals that call the savanna home, then find out how Chester Zoo and its conservation partners monitor animals such as northern giraffes. You'll see how cameras, trackers, and other methods can help scientists gather information about animals in the wild — and why collecting accurate data matters.
Then become a conservation data detective! Work with real wildlife population data to spot trends and turn numbers into bar charts, line graphs, and pie charts. You'll investigate what different kinds of graphs can tell us and consider why scientists and conservation organizations need to communicate their findings clearly.
Finally, take what you've learned beyond the numbers. Use data to think about how people can make choices that help wildlife, collect information from your own class, and turn your findings into a message that could inspire others to take action.
Don't miss the graph worksheets that go with this lesson!
In How Data Transformed Trading, discover how data became a powerful tool for understanding human behavior — and making big money! Meet David Harding, a science graduate who shook up the chaotic world of trading by using math and data to predict price patterns. While others trusted their gut, Harding believed data and the right computer algorithms could crack the code of the stock market. Today, his company invests billions, proving that smart data (and a little science) can change the game! This video is excerpted from BBC’s Horizon: The Age of Big Data, which explores how data has shaped industries, economies, and human behavior.